Code
| t [s] | Red [bit] | IR [bit] | |
|---|---|---|---|
| 0 | 0.000 | 50757 | 55256 |
| 1 | 0.008 | 50756 | 55254 |
| 2 | 0.016 | 50755 | 55252 |
| 3 | 0.024 | 50754 | 55251 |
| 4 | 0.032 | 50753 | 55251 |
14 Jul 2026
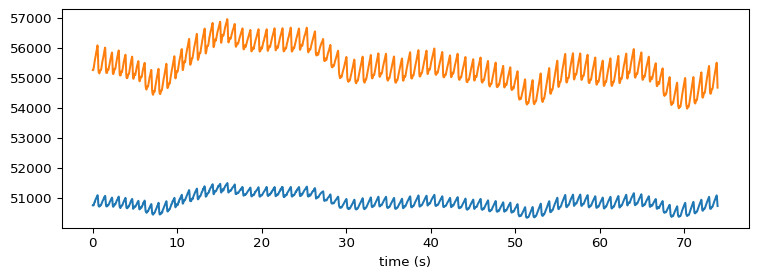
time = data["t [s]"].to_numpy()
sampling_frequency = 1.0 / np.mean(np.diff(time))

ppg_red = data["Red [bit]"].to_numpy().astype(float)
ppg_ir = data["IR [bit]"].to_numpy().astype(float)

_, ax = plt.subplots(figsize=(8, 3))
ax.plot(time, ppg_red, label="red")
ax.plot(time, ppg_ir, label="IR")
ax.set_xlabel("time (s)")
plt.tight_layout()
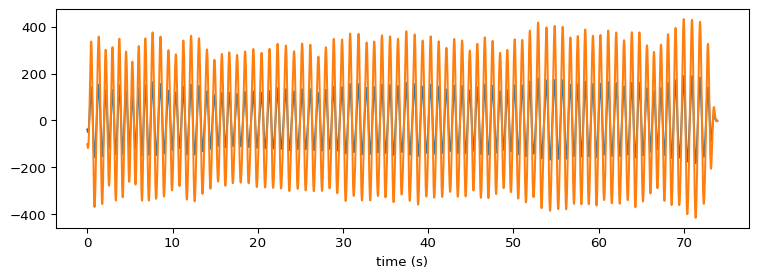
plt.show()Preprocessing focuses on reducing high-frequency (powerline) noise and adjust for baseline wander (e.g. trend or offset removal)
import scipy.signal
nyq = sampling_frequency / 2.0
lowcut = 0.8
highcut = 2.0
low = lowcut / nyq
high = highcut / nyq
order = 4
sos = scipy.signal.butter(order, [low, high], btype="band", output="sos")
filtered_red = scipy.signal.sosfiltfilt(sos, ppg_red)
filtered_ir = scipy.signal.sosfiltfilt(sos, ppg_ir)

_, ax = plt.subplots(figsize=(8, 3))
ax.plot(time, filtered_red, color="tab:blue", label="red (filtered)")
ax.plot(time, filtered_ir, color="tab:orange", label="IR (filtered)")
ax.set_xlabel("time (s)")
plt.tight_layout()
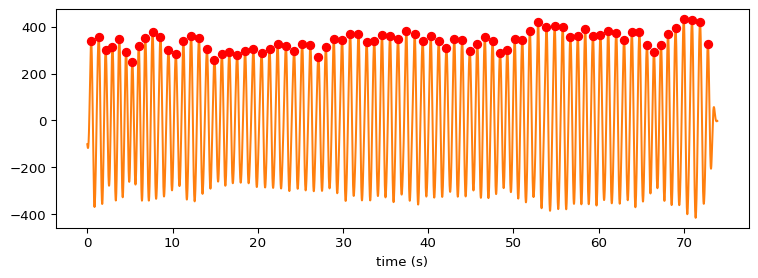
plt.show()Now idenfity peaks to derive the heart rate
thr_min_peak_distance = int(0.5 * sampling_frequency)

peaks_ir, pkprops_ir = scipy.signal.find_peaks(filtered_ir, distance=thr_min_peak_distance, height=np.std(filtered_ir))
peaks_red, pkprops_red = scipy.signal.find_peaks(filtered_red, distance=thr_min_peak_distance, height=np.std(filtered_red))

_, ax = plt.subplots(figsize=(8, 3))
ax.plot(time, filtered_ir, color="tab:orange", label="IR (filtered)")
ax.plot(time[peaks_ir], filtered_ir[peaks_ir], "o", mec="r", mfc="r")
ax.set_xlabel("time (s)")
plt.tight_layout()
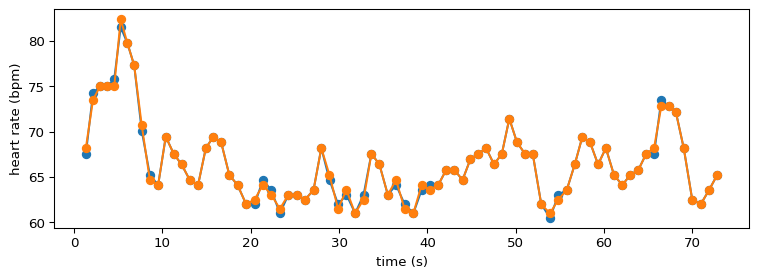
plt.show()# Calculate inter-beat intervals in seconds
peak2peak_ir = np.diff(time[peaks_ir])
peak2peak_red = np.diff(time[peaks_red])
# Calculate instantaneous heart rate (beats per minute, bpm)
heart_rate_ir = 60 / peak2peak_ir
heart_rate_red = 60 / peak2peak_red
# Plot the heart rate
_, ax = plt.subplots(figsize=(8, 3))
ax.plot(time[peaks_red][1:], heart_rate_red, "o-", label="red")
ax.plot(time[peaks_ir][1:], heart_rate_ir, "o-", label="IR")
ax.set_xlabel("time (s)")
ax.set_ylabel("heart rate (bpm)")
plt.tight_layout()
plt.show()